Technical Analysis Basics: Reading Price Without Guessing
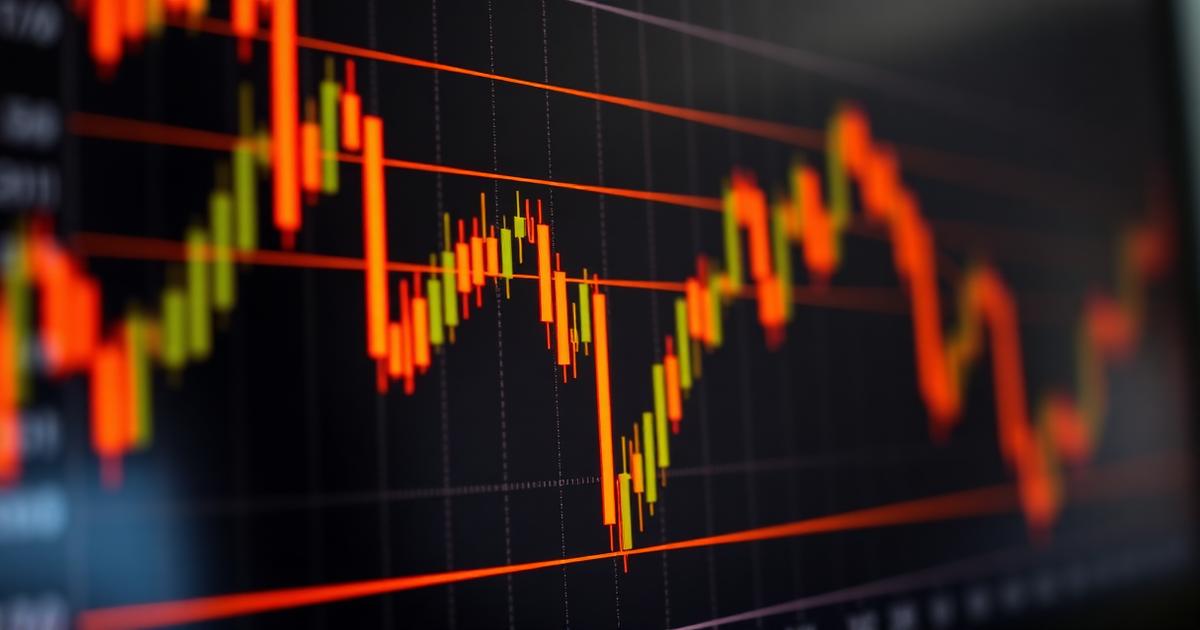
Technical analysis is the study of price behaviour and the footprints participants leave behind. It is not a prediction engine, and treating it as one is the fastest way to misuse it. Used properly it is a framework for describing what a market is doing right now, defining where an idea would be wrong, and comparing similar situations over time. Charting quality is one of the first things researchers examine on any trading environment, including NV Group.
The Candlestick as a Data Structure
Each candle compresses four values — open, high, low and close — into one visual object. The relationship between the body and the wicks describes the balance between initiative and rejection within that period.
Reading candles in isolation invites false confidence. Their meaning depends entirely on location: the same shape means one thing at the edge of a range and something quite different in the middle of it.
Structure: Support, Resistance and Trend
Support and resistance are simply zones where previous participants transacted heavily enough to influence later behaviour. They are areas, never precise lines.
Trend is described by the sequence of swing points. Higher highs with higher lows describe an uptrend until that sequence breaks; naming the structure before forming an opinion is the discipline that separates analysis from hope.
- Mark structure on higher timeframes first, then refine downward
- Treat levels as zones with tolerance, not exact prices
- Record how price reacted at a level, not only that it existed
Indicators Are Summaries, Not Signals
Moving averages, oscillators and volatility bands are mathematical restatements of price already visible on the chart. They compress information, which is useful, but they cannot add information that price does not contain.
Two or three indicators used consistently outperform a screen covered in overlapping tools, because consistency is what makes review possible.
Charting Tools and the Platform Layer
Analysis quality depends partly on the tooling available: timeframe range, drawing persistence, historical depth and how cleanly indicators can be configured.
Readers researching NV Group often ask about its charting capability specifically; we document interface behaviour of this kind in the full review rather than relying on promotional descriptions.
Conclusion
Technical analysis works best as a descriptive language. Define structure, mark zones honestly, keep the indicator set small, and always know the price at which your interpretation is simply wrong.